


Search
Statistical Analysis

The distance ladder and the CMB give incompatible values for the expansion rate. A new study shows just how robust the Hubble tension is.

Is dark energy evolving with at least 99.99% confidence? Despite the quality of recent data, scientists have every reason to be skeptical.

Is the Universe's expansion rate 67 km/s/Mpc, 73 km/s/Mpc, or somewhere in between? The Hubble tension is real and not so easy to resolve.

Whether it’s LeBron's shooting patterns or your corporate AI strategy, actionable insights are the key to turning data into meaningful results.

An extraordinary haberdasher obsessed with buttons, lace collars, and death pioneered modern statistical analysis during the Age of Reason.

How black and white is your thinking?

We have very specific predictions for how particles ought to decay. When we look at B-mesons all together, something vital doesn't add up.

In the expanding Universe, different ways of measuring its rate give incompatible answers. Nobel Laureate Adam Riess explains what it means.

The big question isn't whether the Universe is expanding at 67 or 73 km/s/Mpc. It's why different methods yield such different answers.

The Bullet Cluster has, for nearly 20 years, been hailed as an empirical "proof" of dark matter. Can their detractors explain it away?

Here's what recent DESI measurements suggest — and why it's too early to update conventional predictions about the Universe's distant future.

Almost everything we can observe and measure follows what's known as a normal distribution, or a Bell curve. There's a profound reason why.

Recent measurements of CERN data seem to disagree with standard-model predictions about how the Higgs boson decays, though further analysis is needed to confirm the observations.

Astronomers claim to have found structures so large, they shouldn't exist. With such biased, incomplete observations, perhaps they don't.

Fantasy, meet statistics: The census comes to Middle-earth!

Your life’s memories could, in principle, be stored in the universe’s structure.

They're not just watching you; they're also calculating.

A spherical structure nearly one billion light-years wide has been spotted in the nearby Universe, dating all the way back to the Big Bang.

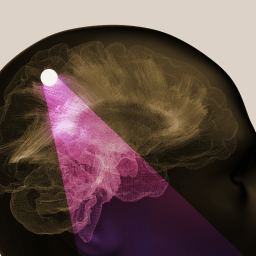
Your heart rate reveals your brain activity, which in turn can predict hit songs — and maybe stock performance, as well.

Probability, lacking solid theoretical foundations and burdened with paradoxes, was jokingly called the “theory of misfortune.”

The meaning of the cryptic text has eluded scholars for centuries. Their latest efforts include computational analyses seeking new insights into the medieval enigma.

The replication crisis has debunked many of psychology’s fair-haired hypotheses, but for the marshmallow test, things have only become more interesting.

Data scientists first gained prominence by making us click on ads — now the profession spans a multiverse.

Not everything that claims to be "scientific" actually is. There are five features of scientifically rigorous studies.

A new 20-year analysis of over 14,000 psychology studies finds that a study's media coverage is negatively linked to its replicability.

The initial goal of AI was to create machines that think like humans. But that is not what happened at all.

The difference between predictions and observations of the magnetic properties of muons suggests a mystery for the Standard Model.

Find your wallet or keys — or a nuclear submarine.

Virtually all the statistical methods researchers commonly use assume potential mating partners decide who they will have children with based on a roll of the dice.

Years of shoddy research have overstated the risk.